Science at work
Today I spent some time analysing a performance problem affecting the website of one of our customers. It’s refreshing to be doing science instead of the more usual programmerly activities of design and engineering. Debugging a problem like that involves wading through mountains of data, some that will be relevant, some that will not, and trying to develop a hypothesis about what is causing the problem.
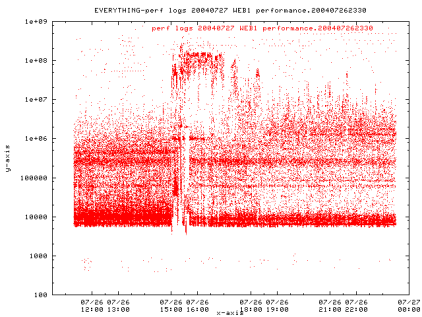
I started off where a colleague of mine stopped. He'd collected logs from the web servers and the database server involved - many megabytes of logs - and started to analyse them. I got to write a couple of quick'n'dirty perl programs that extracted various statistics about response latency from the dataset, and I got to use gnuplot for plotting the results in graphical form.
Interesting graph. See the banding? We're currently wondering what could be causing the band at roughly 250ms (the y-axis is in µs).
I wish I'd done a stats course at uni! Anyway, since this is proper science I'm doing I ought to start keeping a proper notebook, like a proper scientist, keeping track of the experiments I've run and the results I've obtained. I'll start that tomorrow.
